
A model had strong offline performance but its production performance has dropped. How would you diagnose and recover the system?
Interview preparation resource from Gate Smashers.
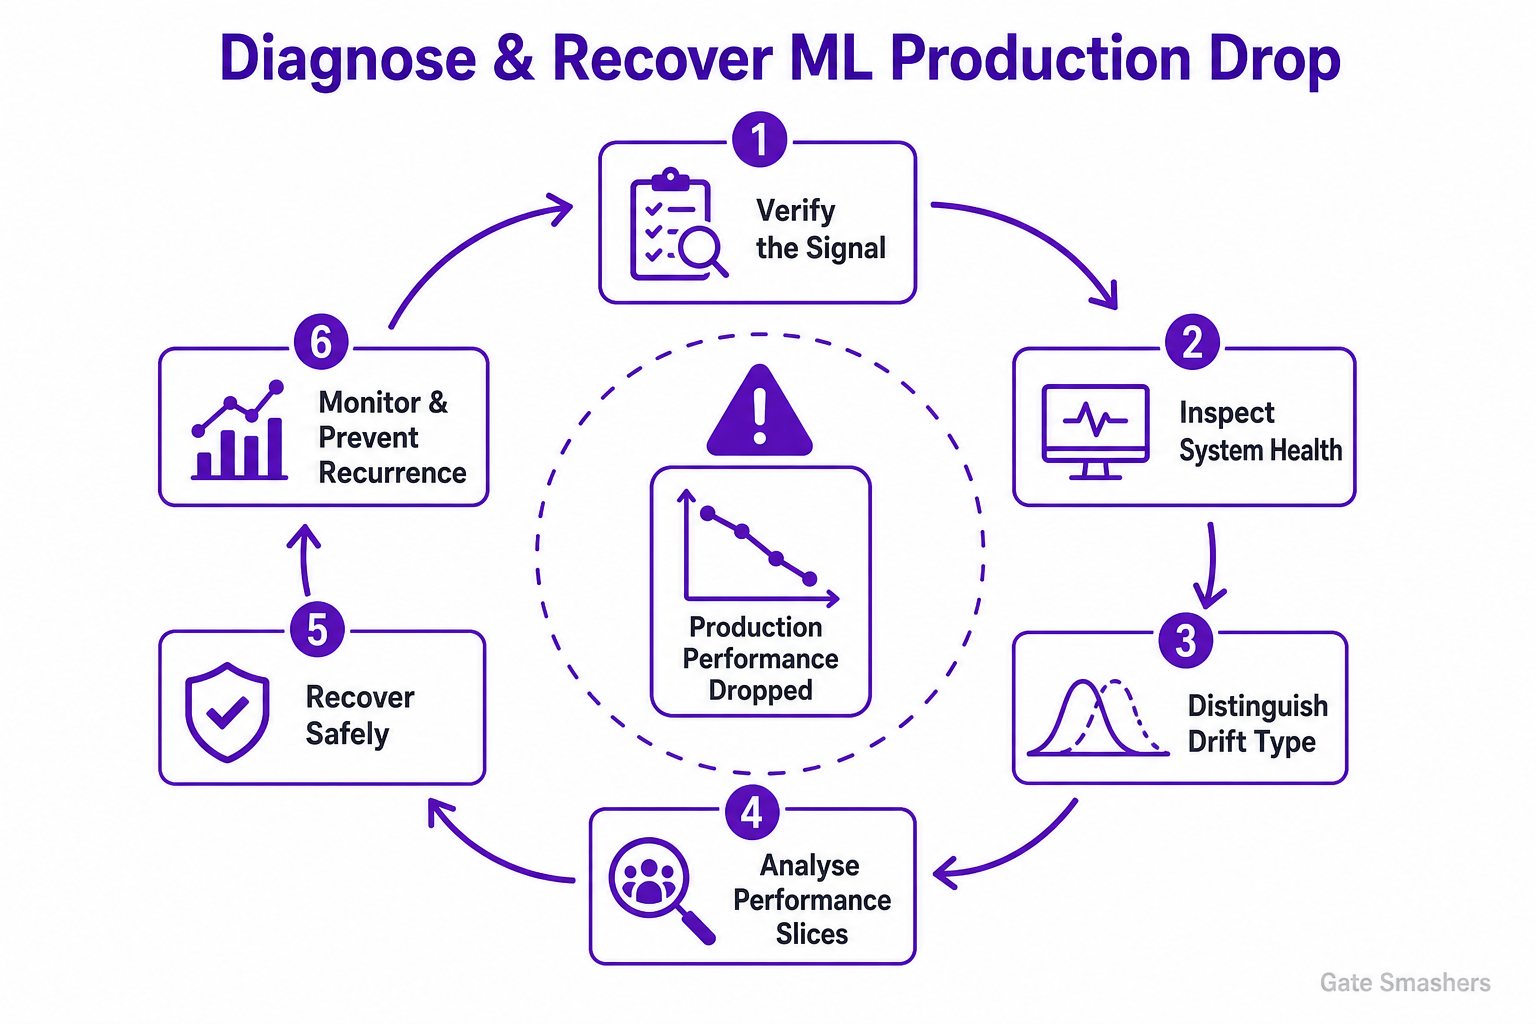
I would first confirm the drop is real by checking metric definitions, label delay, logging and pipeline health. Then I would separate data quality issues, training–serving skew, data or concept drift, threshold and calibration changes, and upstream product changes. I would compare production and training distributions by feature and segment, inspect errors with fresh labels, mitigate safely through rollback or fallback rules, and retrain only after identifying the cause and validating the replacement model.
| Failure class | Evidence to inspect | Typical response |
|---|---|---|
| Measurement issue | Metric code, labels, joins, attribution window | Repair measurement before model changes |
| Data quality | Missingness, range, freshness, schema | Fix pipeline and backfill safely |
| Training–serving skew | Offline vs online feature values | Unify feature logic and redeploy |
| Data / concept drift | Feature distributions and labelled slice metrics | Recalibrate, retrain or redesign |
| Service issue | Latency, timeouts, fallback and version mix | Rollback or restore dependency health |
PSI is one possible summary of distribution change between reference proportions pᵢ and current proportions qᵢ. Thresholds are context-dependent and PSI alone does not prove concept drift.
Step 1: verify the signal
A dashboard change is not automatically a model failure. Confirm that the same metric, population, attribution window and label definition are being compared. Check whether recent labels are incomplete and whether instrumentation or joins changed.
Step 2: inspect system health
- Feature pipeline: Missing values, stale features, schema changes, unit changes and incorrect defaults.
- Training–serving skew: Different preprocessing, encodings or feature definitions between offline and online paths.
- Service behaviour: Timeouts, fallback rates, model-version mix, latency and dependency failures.
- Product changes: A new UI, policy, campaign or traffic source can alter who receives predictions and how they respond.
Step 3: distinguish drift types
Data drift means the input distribution changes. Label shift means changes. Concept drift means the relationship changes. Feature-distribution tests can detect some input changes, but labelled outcome data is usually needed to confirm degradation in the predictive relationship.
Step 4: analyse performance slices
Compare cohorts by geography, device, acquisition channel, model score, class, time and other meaningful segments. Inspect fresh false positives and false negatives. A global average can hide a severe failure in one high-value segment.
Step 5: recover safely
Rollback a faulty release, repair the feature pipeline, apply a safe fallback or adjust traffic if users are at risk. Retrain with recent representative data only after verifying labels and leakage boundaries. Shadow-test and canary the replacement model before a full rollout.
Prevention
Monitor feature quality, prediction distributions, calibration, business outcomes, latency and model versions. Record data and model lineage, define alert thresholds and maintain rollback and retraining playbooks. Automatic retraining should still have quality gates; blindly retraining on corrupted data can make the incident worse.